
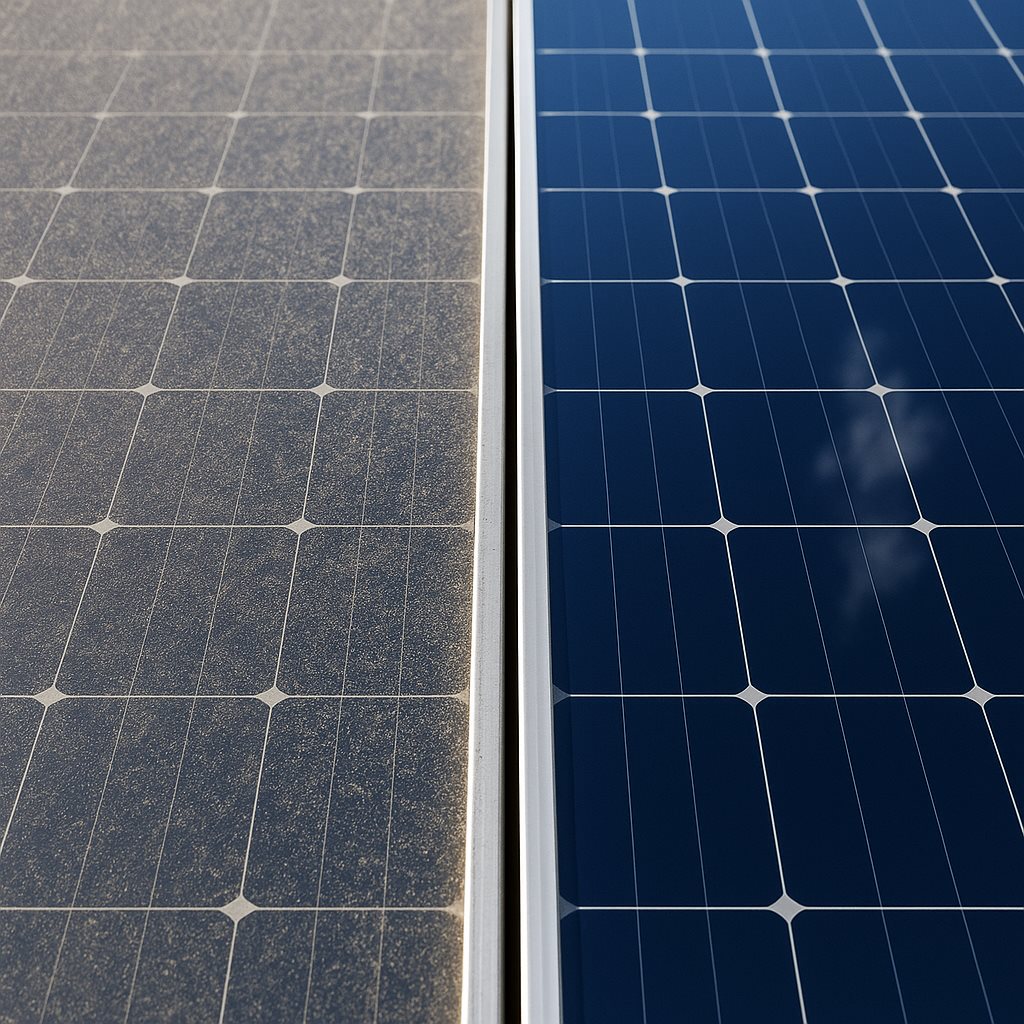
Ask five people in the solar industry how much output dirty panels lose and you will get five answers spanning an order of magnitude. Someone will say 2 percent, someone will say 30, and both will be right, because they are describing different sites in different seasons. The number is not a constant. It is a rate that depends on where the plant sits, what is in the air, how the modules are tilted and how long it has been since the last rain. Understanding how much energy dirty solar panels lose starts with replacing the single number with a range you can actually measure on your own asset.
What soiling loss actually measures
The industry term is the soiling ratio, defined in IEC 61724-1 as the output of a soiled device divided by the output of an identical clean one. A soiling ratio of 0.95 means the array is producing 95 percent of what it would produce clean, so the soiling loss is 5 percent.
Two related figures matter alongside it. The soiling rate is how fast that ratio declines, expressed as percent per day, and it is the number that determines cleaning intervals. The annual soiling loss is the energy lost across a full year under a given cleaning regime, and it is the number that belongs in the financial model.
Confusing them is the source of most of the disagreement. A site can have an alarming daily soiling rate and a modest annual loss if it is cleaned often, and a low rate with a large annual loss if it is never cleaned at all.
The global picture
The most cited assessment remains the 2019 techno-economic study published in Joule by Ilse and colleagues, which concluded that even under optimised cleaning, soiling reduces global solar production by at least 3 to 4 percent, representing several billion euros of lost revenue annually, with the figure projected to rise as capacity grows in high-soiling regions.
That 3 to 4 percent is a global average across all climates, and it already assumes cleaning is happening. It is the residual loss that remains after maintenance, not the loss from neglect. Read it as a floor rather than as a typical site figure.
NREL’s work on US installations puts the annual range from near zero in wet, temperate regions to around 7 percent in the drier southwest, and notes that in parts of North Africa and the Middle East, losses on uncleaned modules can reach several tens of percent.
Typical ranges by environment

The following ranges reflect what published field measurements consistently show. Treat them as a starting hypothesis for a site, never as a substitute for measurement.
- Temperate and rainy climates. Annual losses commonly in the low single digits. Regular rainfall does much of the work, and the residual loss concentrates in dry spells and pollen season.
- Semi-arid and Mediterranean. Mid single digits annually, with strong seasonality. Losses build through the dry months and reset with the first substantial rain, so the annual average conceals a much worse summer.
- Desert and high-dust regions. This is where the range explodes. Field studies in Qatar and Saudi Arabia have reported daily losses in the range of 0.5 to 1 percent per day on uncleaned modules, and above 1 percent per day where sandstorms are frequent. Without cleaning, that compounds into losses of tens of percent within a season.
- Coastal. Moderate deposition rates but a deposit that resists removal, because salt dissolves and recrystallises nightly and cements dust to the glass. The measured loss is often unremarkable while the recovery after cleaning steadily worsens.
- Agricultural and agrivoltaic. Highly seasonal and event driven. Ploughing, harvest and nearby field work can produce a step change in a single day that no schedule anticipates.
- Industrial and roadside. Lower deposition mass but stickier composition. Combustion particulates and hydrocarbons bond to glass and are harder to remove than mineral dust of the same weight.
Tilt, season and the variables people forget
Two plants in the same town can have very different soiling numbers, and the reasons are usually mundane.
Tilt angle is the strongest single modifier. A five-year field study in the UAE, conducted under IEC 61724-1, measured soiling rates ranging from about 0.04 percent per day at high tilt angles to about 0.45 percent per day at low tilt, an order of magnitude difference driven purely by geometry. Low-tilt arrays hold dust that steep arrays shed, and they retain water rather than draining it.
Time since rain matters more than annual rainfall. A climate with 400 mm falling in four events behaves very differently from the same 400 mm spread across the year.
Light rain can make things worse. Insufficient rainfall to rinse the array wets the dust, mobilises it and leaves a cemented film once it dries. Operators frequently see output fall after a light shower.
Row position is not neutral. Edge rows facing a service track, a boundary road or bare ground consistently soil faster than interior rows, which is why a single reference station in the middle of the array can systematically understate site-wide loss.
Why the average understates the damage
Reporting soiling as one annual percentage hides three effects that carry real money.
Losses cluster in the highest-value months. Soiling peaks in the dry season, which is generally also the period of highest irradiance and, in many markets, the highest energy prices. A 6 percent average loss weighted toward summer costs considerably more than 6 percent of annual revenue.
Soiling is not uniform, and non-uniform soiling is worse than its average. A band of heavy deposit along the lower edge of a module, typical where water and dust drain together, can force cell mismatch losses disproportionate to the area covered, and in severe cases creates localised heating.
Some of the loss never comes back. Deposits that cement onto glass, or that require aggressive removal, leave permanent transmission loss or coating damage. That is the part of the bill that never appears in a soiling report, and it is the subject of our analysis of the hidden costs of inadequate cleaning.
Turning a loss rate into a cleaning decision
Once you know the soiling rate, the cleaning interval is arithmetic rather than opinion.
The energy recovered by a cleaning event equals the accumulated loss at the moment of cleaning, integrated over the interval. Cleaning is worth doing when the value of that recovered energy exceeds the cost of the cleaning event. Because the loss accumulates continuously while the cost is incurred per event, the answer depends heavily on the cost per event.
That is the whole reason automation changes the economics rather than just the labour bill. When a cleaning pass costs a mobilised crew, long intervals are the rational choice and the array spends most of the year soiled. When the marginal cost of a pass is water and a small amount of energy, short intervals become optimal and the array spends most of the year near its clean baseline. The financial comparison is worked through in our analysis of the ROI of autonomous cleaning, and the interval logic itself in the cleaning frequency guide.
Measuring your own number

Published ranges are a hypothesis. Your site has one real figure, and there are three ways to find it.
A soiling station gives a direct, continuous soiling ratio from a paired clean and soiled reference device. It is the most rigorous method and needs somebody to actually clean the reference.
A clean reference string compares a deliberately maintained string against representative production strings. Cheaper, effective at scale, and dependent on the reference being genuinely comparable in orientation and shading.
A cleaning step test is the quickest first answer: record output before and after cleaning a defined block under stable irradiance, and the step change is your accumulated loss. Repeat across seasons to build a rate.
Sensor-based approaches and the analytics layered on top of them are covered in our article on smart soiling detection. Whichever method you choose, run it long enough to capture a full dry season, because a measurement taken the week after rain will tell you almost nothing.
The bottom line
There is no universal answer to how much dirty panels cost you, and any vendor offering one is selling rather than measuring. What the published evidence does establish is a defensible frame: global average losses of at least 3 to 4 percent even with cleaning, low single digits in wet temperate climates, mid single digits across semi-arid regions, and daily rates approaching or exceeding 1 percent per day in the world’s dustiest locations.
The gap between those extremes is wide enough that operating on an assumed number is a financial decision, not a technical shortcut. Measure the rate on your own array across a full season, weight it for when the energy is actually worth something, and let the resulting figure drive the cleaning interval. If you would like help setting up that measurement before committing to any cleaning strategy, it is a short exercise with a long payback.
Frequently Asked Questions
How much efficiency do dirty solar panels lose?
It depends on climate and time since cleaning. Wet temperate sites typically lose low single-digit percentages annually, semi-arid regions mid single digits, and desert sites can lose 0.5 to 1 percent per day or more on uncleaned modules. The most cited global assessment puts average losses at 3 to 4 percent even where cleaning already takes place.
What is a soiling ratio?
It is the output of a soiled device divided by the output of an identical clean one, defined in IEC 61724-1. A soiling ratio of 0.95 corresponds to a 5 percent soiling loss. It is the standard basis for both measurement and contractual cleaning obligations.
Does rain clean solar panels well enough?
Heavy rain rinses arrays effectively and does much of the maintenance work in wet climates. Light rain often makes things worse by wetting dust, mobilising it and leaving a cemented film as it dries. Rain also cannot be scheduled, which is why it is unreliable as the basis for a maintenance program.
Does panel tilt affect how quickly panels get dirty?
Substantially. A five-year field study in the UAE measured soiling rates roughly ten times higher at low tilt angles than at high tilt, because steep modules shed dust and drain water while shallow ones retain both. Low-tilt and near-horizontal arrays need shorter cleaning intervals.
How do I measure soiling loss on my own site?
Use a soiling station for continuous measurement, a deliberately clean reference string for a lower-cost approach at scale, or a before-and-after cleaning step test on a defined block for a quick first answer. Measure across a full dry season, since a single reading is heavily dependent on when it was taken.
Is the annual average soiling figure enough for financial modelling?
Not on its own. Soiling peaks in the dry season, which usually coincides with the highest irradiance and often the highest energy prices, so the revenue impact is weighted more heavily than the annual energy figure suggests. Model the loss profile through the year rather than applying a flat percentage.